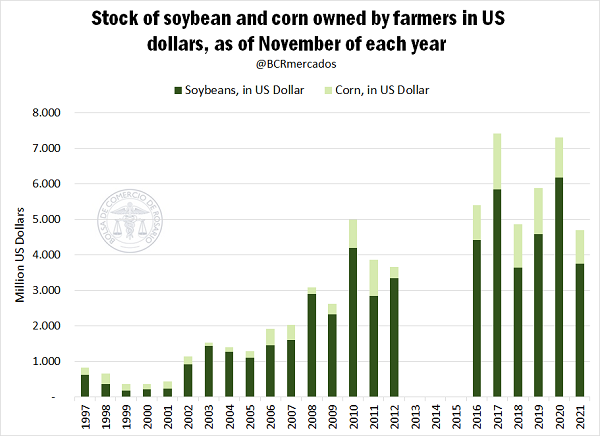
As of November, farmers have soybean and corn for USD 4.7 billion to sell, the lowest in 6 years
It is estimated that the corn and soybean stocks in the hands of the farmers at the beginning of November (that is, averaging the middle of the trade season for coarse grains[1]) amounted to 4.7 billion dollars throughout the country. In terms of FOB dollars, this value is the lowest of the last 6 years even despite the appreciation of prices, which denotes the agile volume of trade of the current crop season.
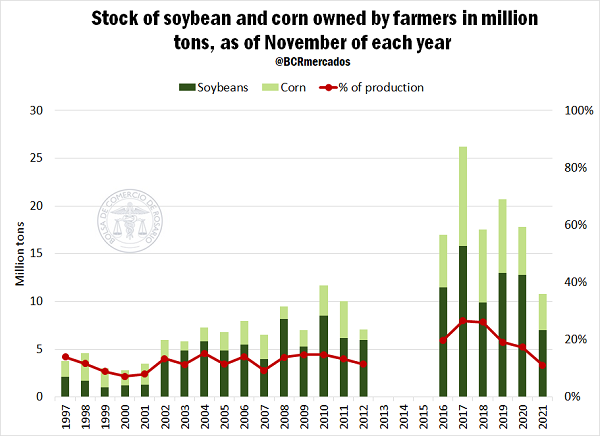
If we look at the tons, the estimates are even more impressive, as they mark another low-level record. The estimated stocks in the hands of the farmers are lower than in 2010, as a result of the combination of a drop in soybean production due to the lack of water and the greater flow of business during the crop season. The graph below shows the aforementioned drop in the value of the main coarse grain holdings in the hands of farmers in November 2021. Between November 2020 and November 2021, this decrease represents 7 Mt or 65% of holdings.
Although the Argentinian Ministry of Agriculture, Livestock and Fisheries (MAGyP, for its Spanish acronym) discontinued the publication of the series of the trading stock between 2013 and 2015, making it difficult to calculate stocks held by the productive sector, there is a growing trend in the level of long-term stocks that is consistent with a higher production. However, measuring the level of stocks as a share of production (red line), it is observed that the ratio fell in 2021 for the fourth consecutive year to a 9-year minimum according to the information available.
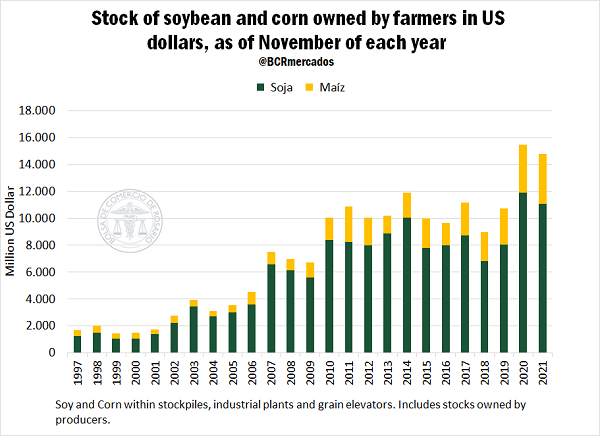
If the total estimated stocks as of November of each year are now analysed, it can be seen that, despite the 710 million dollar drop in the value of holdings compared to the previous year, this is still the second highest on record, with 14,779 million dollars. However, this is due to a price effect since, if we look at the grain stock in tons in the hands of the trade chain, it remained in a stable range during the last 7 years.
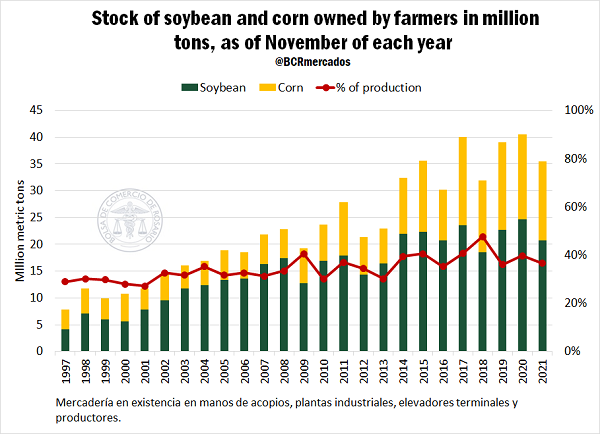
As in the case of the productive sector, a growing trend can be observed in the volume of stocks as of November that has been registered throughout the entire trade chain in recent decades. Even despite the lower volume of stocks compared to November 2020, they still triple the values of the beginning of the millennium. However, again, these data must be viewed in relation to the production of each crop season, as reflected in the red line. In these terms, the level of stocks with respect to production for mid-trade season (the month of November) tends to remain relatively stable in the range of 30% to 48% during the last 20 years.
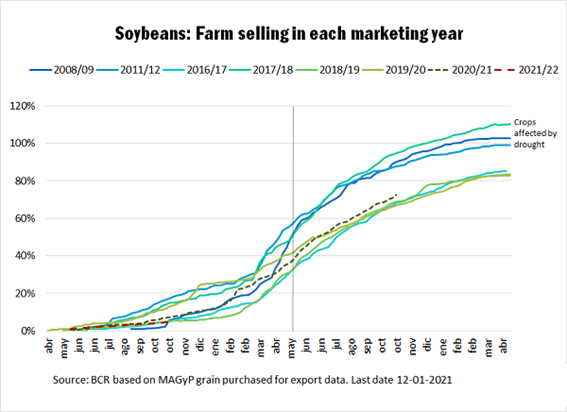
Finally, the high fluidity of the trade during this crop season can be verified based on the purchases reported by exporters and manufacturers to MAGyP. As can be seen in the attached chart, producers are delivering the goods and there is no delay in comparison to other years. During crop season 2020/21 to date, manufacturers and exporters have bought, according to official records, 72.6% of production. This value is almost in line with past campaigns. The first graph included shows the three most recent crop seasons, the trade of the new crop season (2021/22) and the last three crop seasons that, like this one, showed problems of lack of adequate humidity for the crops. It can be seen that the farmer sells approximately 40% of his production before harvest or during harvest and the remaining 60% after the harvest period.
On the other hand, it can be observed that, in crop seasons with normal weather, a large part of soy production is sold up to 80% on these channels (industry and export). The rest of the soybean is used for other productive activities not reached by the MAGyP survey (production of expellers and animal feed, non-registered plants, use of deactivated or non-deactivated grain for animal feed, among others) or to expand the necessary stocks by the actors in the chain (crushing industries, animal feed, producers or the animal feed sector). In dry years, the sector's sales to final consumption (industry and export) exceed production as farmers liquidate their stocks to meet expenses throughout the year.
Regarding final stocks, and the discernment of which ones are in the hands of the farmers, it should be clarified that the numbers presented here have been estimated based on the absorption flow, since there is no database of stocks in the hands of the farmers. The historical stock base is only present for grains in the hands of actors in the trade chain (grain collectors, manufacturers and exporters). For this reason, the estimated data of stocks in the hands of farmers must be taken with due consideration.
[1] The trade year runs from March to February for the corn farmer, and from April to March for the soybean farmer.