ROSPORC, the first electronic trading platform for swine in Argentina, was developed by the Rosario Board of Trade (BCR), and it allows users to buy and/or sell swine with great ease. It started operations in mid-August 2020 and has been active for more than 18 months.
At ROSPORC, the main segment traded is the hog and, for the eighth week of 2022, i.e., between February 13th and 19th, the average quote reached a value of $ 176.7/kg, which did not imply any changes concerning the previous week’s quotes. In addition, this represents only a 0.8% change from the prices recorded in the first weeks of December 2021. On the other hand, in week 8 of 2021, the average market price was $ 119/kg, thus showing a nominal year-on-year increase of 48.5%.
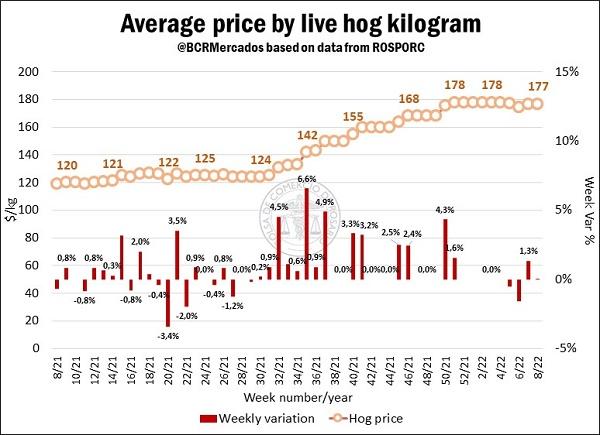
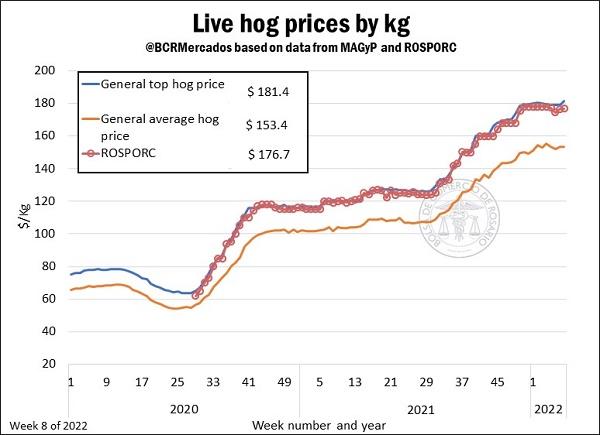
The average quote of ROSPORC operations is highly correlated with the general maximum live hog price published by the Argentinian Ministry of Agriculture, Livestock, and Fisheries (MAGyP, for its Spanish acronym). In this sense, the value published by MAGyP for week 8 (February 14 to 20) for the kilo of the general maximum live hog was $ 181.39/kg, while on the ROSPORC platform the value for the same week was $ 176.7/kg, resulting in a difference lower than 2.68% between both quotes.
Activity indicators
Bearing in mind that, according to different analyses and studies carried out on the pork market, swine feed accounts for between 60 and 70% of production costs, the prices of these inputs and their evolution over time are variables of paramount importance for breeding. Knowing that pigs’ diet is mainly based on corn and soybean by-products, we elaborated the following indexes commonly used within the sector:
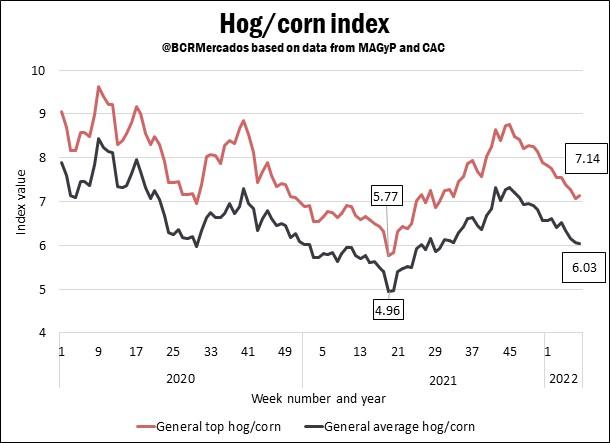
* Hog/corn index: this indicator reflects the ratio between the relative price of corn and the prices of hogs in the domestic market over time. It results from dividing the price of hog by the price of a kilogram of corn, thus reflecting how many kilograms of corn can be bought with the proceedings per kilogram of the sale of live hogs at a given point in time. If we analyse the variations of this index in the last few months, it can be said that during the whole of 2020 and until week 19 of 2021, there was a downward trend until minimum values were reached in at least 2 years for the general maximum hog/corn (5.77) and general price hog/corn (4.96) ratios. From that point on, there was an increase in these figures until week 45 of 2021, when the last peaks were reached. Also, the latest observable trend in the index is a new segment with declines in recorded values. In this regard, a decrease has been observed almost constantly in recent weeks, reaching records of 7.14 for the general maximum hog/corn and 6.03 for the general maximum/corn in the eighth week of 2022.
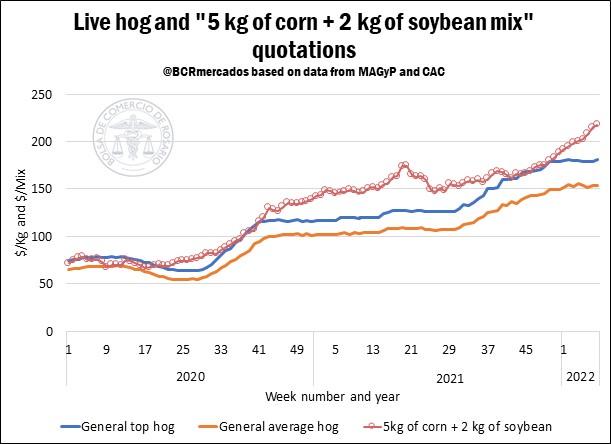
* “5 kg of corn + 2 kg of soybean mix”: in the sector, this indicator is often used under the idea that the value in pesos of one kilogram of live hog should equal the sum of the market value of 5 kg of corn and 2 kg of soybean. It is a market convention upon which we make no judgement as to whether it should or should not be complied with. We simply calculate it as an additional indicator for decision-making.
It is a reference to what the theoretical price the hog should have in relation to the price of these two essential grains for animal feed: corn and soybean.
In the chart, three variables are compared:
a) Price in pesos of “5 kg of corn + 2 kg of soybean mix”.
b) Maximum price in pesos of live hog.
c) Average price in pesos of live hog.
The evolution of this “Mix” and the maximum prices of hogs surveyed by MAGyP shows cycles where both figures tend to separate and then converge. Over the past two months, there was a sustained divergence between the values taken by one indicator and the other. At present, the differential between both quotes is only $ 36.3 (week 8 of 2022), since the “Mix” reached a value of $ 217.7 and the general maximum live hog was $ 181.4. The difference between both values is 20% of the value of the general maximum live hog, which results in a new separation between the production costs and the market income from the 10.5% differential recorded in the previous report. Likewise, this 20% difference between the indicators exceeds the average value of the 2021 differentials, since the average difference for that year was 13.9% of the value of the general maximum live hog. Finally, it should be noted that with these values it can be stated that there is a slight delay in the prices of live animals compared to production costs.
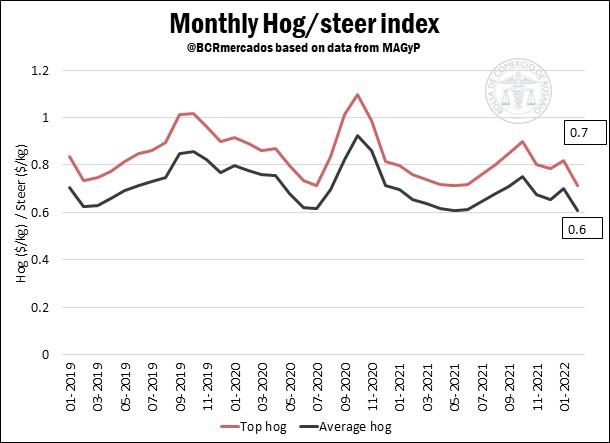
* Hog/steer index: following a similar methodology to that of the hog/corn index, which reflects the evolution of relative prices, in this case, we analysed the performance of the quotes per kilogram of live beef and pork since 2019, represented by their highest exponents in terms of domestic trade. In this sense, hog prices surveyed by MAGyP are used again, while for the value of steer we used the monthly quotes released by Mercado de Liniers S.A. cattle market. Again, the value of live hog is divided by the value of steer, taking into account the monthly average values in both cases, representing how many kilograms of live steer are needed to buy a kilogram of live hog in the markets.
This ratio usually ranges from 0.6 to 1. In recent months a decline has been reported for both indices due to the rise in the prices of the steer, while the price of the hog remained stable. As a result, the maximum general live hog/steer ratio is 0.71, while the average general live hog/steer ratio is 0.61 by early March, both of which are just above the May 2021 lows.
Indicators of the pig market
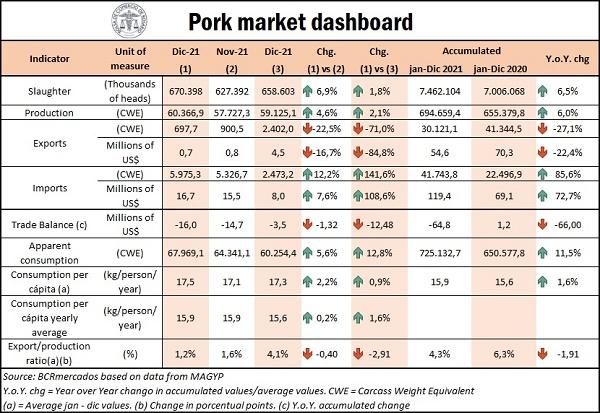
Pig slaughter in December 2021 was 670,398 head, resulting in a 5.3% increase over the previous month, and a 1.8% increase over the same month in 2020. In cumulative terms, pig processing reached 7.46 million heads throughout 2021, surpassing by 6.5% the previous year, when a little over 7 million were slaughtered. Subsequently, meat production in the last month of 2021 was 60,336 tons, implying a 4.9% increase from the previous month (57,727 tons), while the variation from December 2020 was 2.1%. Also, the final volume of pork production for 2021 was 694,659 tons, 6% above the 2020 results.
With regard to foreign trade, exports in December were only 697.5 tons, resulting in a fall (-22.5%) compared to the previous month. The decrease in export is even greater when compared to the same month of 2020 when 2,400 tons (-71%) were shipped abroad. The import in December 2021 was 5,975 tons, exceeding the 5,327 tons of November by 12.7% and those of December 2020 by 141.6%. If we compare exports and imports in terms of dollars, a trade deficit balance of $16 million is obtained by December 2021 alone. In cumulative terms, 2021 yields net expenditures of $64.8 million dollars. Finally, the share of exports in pork production at a national level (export/production ratio) dropped again by 1.2 percentage points in December and by 4.3% in all of 2021.
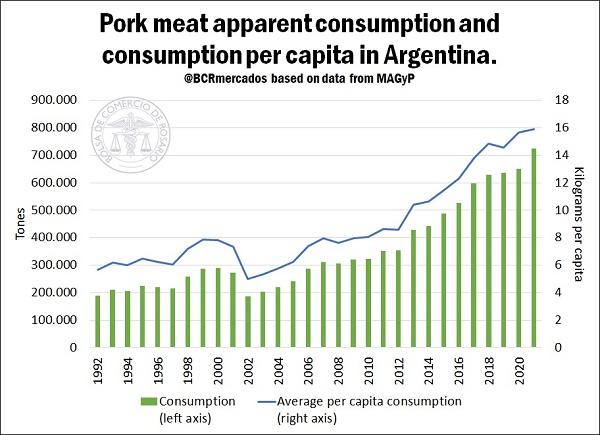
Apparent consumption in the last month of 2021 was 67,969 tons, exceeding by 5.6% the previous month and by 12% the same month in 2020. In addition, the annual per capita consumption was 15.9 kg/inhabitant/year, just 0.2% above the previous month, while the year-on-year increase is 1.6% compared to the record for the same month of 2020 (15.6 kg/inhabitant/year).
Highlight of the pig market
The pig market does not stop its growth in the country. 2021 set records on numerous industry indicators. Slaughter, production, apparent consumption, and per capita consumption are probably the main records that reached maximum values in 2021. Likewise, the particular relevance of the local market as a destination for production should also be highlighted, since internal absorption accounts for about 95% of pork purchases.
In Argentina since the beginning of this millennium, apparent consumption has remained on a path of almost uninterrupted growth. The year 2002 marked the minimum of the series published by the MAGYP, with 186,999 tons absorbed internally. This tonnage was multiplied by almost 3.9 to reach the volumes consumed in 2021. In other words, within the national territory, a little over 725,000 tons of pork were consumed in the last year. This record exceeds by 11.5% the tons that were absorbed internally in 2020. In addition, between the same years, the local market share increased from 93.7% to 95.7%, implying an increase in local consumption over the export destination. This has, as a counterpart, that the export/production ratio has fallen from 6.3% to 4.3% between those years.
Finally, it should also be considered that the increase in the consumption of pork meat has been growing above the increase in the population, resulting in a higher level of absorption per person. In other words, individuals have increased the share of this type of meat in their diets. While in the 2000s, the average per capita consumption per year was around 6.8 kg/inhabitant/year, in 2021 people consumed a volume of about 15.9 kg/inhabitant/year. With these data we can affirm that the growth in pork consumption in recent years is close to 9 kg/inhabitant/year, resulting in more than double of historical intake records per person and averaging an annual consumption growth rate per person close to 6.5% since 2002.